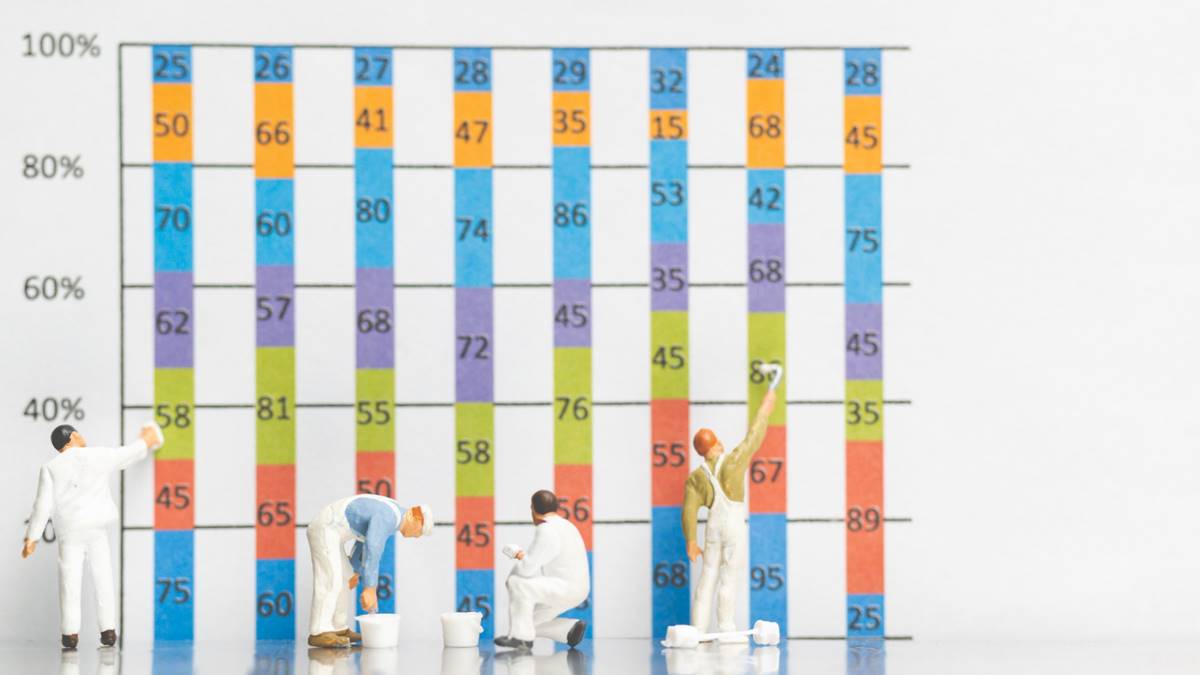
Personality tests have become an essential part of modern life, used everywhere from workplaces and schools to dating apps and self-development programs. These tests aim to capture the complex patterns of human behavior, preferences, and traits in a structured way. Yet, the numbers and categories on their own can feel abstract or confusing. That’s where a personality test bar graph comes in—it transforms raw data into a clear, visual representation that helps people instantly understand their results.
Why personality tests are so popular
Over the last few decades, personality assessments like the Myers-Briggs Type Indicator (MBTI), the Big Five, and DISC have gained enormous popularity. People are naturally curious about what makes them unique, and these tests provide insights into areas such as:
-
Strengths and weaknesses
-
Preferred communication styles
-
Leadership potential
-
Compatibility with others
-
Stress responses and coping mechanisms
Employers use them for team building, psychologists use them for research, and individuals use them to better understand themselves. But regardless of the purpose, visual tools like bar graphs make the results far more digestible.
What is a personality test bar graph?
A personality test bar graph is a chart that displays test results using horizontal or vertical bars. Each bar represents a trait, score, or category. The length of the bar shows the strength of that trait relative to others.
For example, in a Big Five personality test, you might see five bars representing:
-
Openness
-
Conscientiousness
-
Extraversion
-
Agreeableness
-
Neuroticism
If your extraversion bar is long while neuroticism is short, the visual instantly communicates that you are outgoing and emotionally stable.
Why bar graphs are effective in personality testing
Bar graphs work particularly well for personality results because:
-
They simplify data: Instead of reading complex percentages or reports, you see the information at a glance.
-
They highlight comparisons: It’s easy to see which traits are stronger or weaker relative to one another.
-
They are universal: Visuals transcend language and cultural barriers, making them widely understandable.
-
They support memory: People are more likely to remember their results when they’re displayed visually.
This visual clarity helps both test takers and professionals interpret results more effectively.
Examples of how bar graphs are used in personality assessments
Different personality assessments use bar graphs in unique ways:
-
Big Five: Displays scores on five major personality dimensions, often on a scale of low to high.
-
DISC test: Shows dominance, influence, steadiness, and conscientiousness levels with four separate bars.
-
Emotional intelligence tests: Break down areas like empathy, self-awareness, and self-regulation in bar format.
-
Workplace assessments: Highlight skills such as leadership, teamwork, or adaptability with bar comparisons.
In each case, the graph takes abstract psychology and makes it concrete.
The psychology of visual learning
Humans are wired for visual learning. Studies show that the brain processes visuals about 60,000 times faster than text. A personality test bar graph taps into this strength, allowing individuals to make quick, intuitive judgments about their results.
Instead of wading through paragraphs of explanations, users can immediately recognize patterns. For instance, someone might realize they have equally high openness and conscientiousness, meaning they’re both creative and organized—an unusual but powerful combination.
How to interpret your bar graph results
Seeing the bars is only the first step; understanding them is where the real insight comes in. Here are a few tips:
-
Look for dominant traits: Which bars are longest? These often shape your overall personality.
-
Notice contrasts: A long extraversion bar alongside a short agreeableness bar might suggest someone outgoing but not always accommodating.
-
Consider balance: Traits that are more evenly distributed suggest flexibility, while extreme highs and lows can indicate strong preferences.
-
Context matters: Scores don’t exist in isolation—interpret them in relation to your goals, environment, and experiences.
Limitations of personality test bar graphs
While bar graphs are helpful, they’re not perfect. Some limitations include:
-
Oversimplification: Reducing personality to bars can ignore the nuances of human behavior.
-
False precision: Test results often give the impression of exact measurement, even though personality is fluid.
-
Cultural bias: Many tests were developed in Western contexts and may not fully reflect other cultures.
-
Misinterpretation: Without guidance, some people may misread what their scores mean.
This is why psychologists often recommend using graphs as one tool among many, rather than the sole basis for decisions.
Real-world applications of bar graphs in personality tests
The practical benefits of visualized personality data are clear:
-
In workplaces: Managers use bar graphs to see how team members complement each other’s strengths.
-
In therapy: Counselors use them to illustrate progress in emotional growth.
-
In education: Teachers use personality assessments with bar graphs to better support students’ learning styles.
-
In personal growth: Individuals use them as a baseline for self-improvement, tracking changes over time.
By making results more tangible, bar graphs encourage engagement and reflection.
The future of personality test visuals
As technology advances, personality test results are moving beyond static bar graphs. Interactive dashboards now allow users to click on bars for deeper explanations, compare results across time, and even integrate with AI-driven recommendations.
But even as these tools evolve, the simplicity of the bar graph remains timeless. Its ability to communicate complex data quickly ensures it will remain a staple in personality testing for years to come.
Final thought
At first glance, a personality test bar graph might look like just another chart. But in reality, it’s a powerful bridge between psychology and everyday understanding. By turning complex results into simple visuals, it empowers people to see themselves more clearly, reflect on their strengths and weaknesses, and make better choices in life and work.
So, the next time you take a personality test, don’t just glance at the numbers—pay attention to the graph. Those colorful bars could hold the key to unlocking a deeper understanding of who you are.
